navis.plot1d
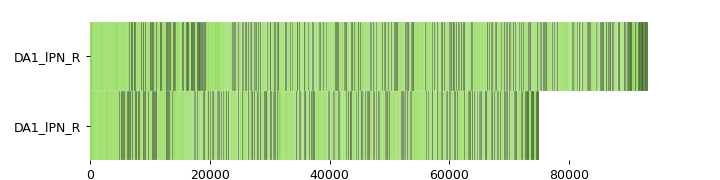
Plot neuron topology in 1D according to Cuntz et al. (2010).
This function breaks a neurons into segments between branch points. See Cuntz et al., PLoS Computational Biology (2010) for detailed explanation. For very complex neurons, this neuron “barcode” can get fairly complicated - make sure to zoom in.
- Parameters:
x (TreeNeuron | NeuronList) – Neuron(s) to plot.
ax (matplotlib.ax, optional) –
color (tuple | dict) – Color. If dict must map neuron UUID to color.
palette (str | array | list of arrays, default=None) – Name of a matplotlib or seaborn palette. If
coloris not specified will pick colors from this palette.color_by (str | array | list of arrays, default = None) – Can be the name of a column in the node table of
TreeNeuronsor an array of (numerical or categorical) values for each node. Numerical values will be normalized. You can control the normalization by passing avminand/orvmaxparameter.**kwargs – Will be passed to
matplotlib.patches.Rectangle.
- Return type:
matplotlib.ax
Examples
>>> import navis
>>> import matplotlib.pyplot as plt
>>> n = navis.example_neurons(2)
>>> ax = navis.plot1d(n)
>>> plt.show()
Close figures (only relevant for doctests)
>>> plt.close('all')
See the plotting tutorial for more examples.