navis.plot_flat
Plot neuron as flat diagrams.
- Parameters:
x (TreeNeuron) – A single neuron to plot.
layout ('subway' | 'dot' | 'neato' | 'fdp' | 'sfpd' | 'twopi' | 'circo') – Layout to use. All but ‘subway’ require graphviz to be installed. For the ‘fdp’ and ‘neato’ it is highly recommended to downsample the neuron first.
connectors (bool) – If True and neuron has connectors, will plot connectors.
highlight_connectors (list of connector IDs, optional) – Will highlight these connector IDs.
ax (matplotlib.ax, optional) – Ax to plot on. Will create new one if not provided.
shade_by_length (bool, optional) – Change shade of branch with length. For layout “subway” only.
normalize_distance (bool, optional) – If True, will normalise all distances to the longest neurite. For layout “subway” only.
**kwargs – Keyword argument passed on to the respective plotting functions.
- Returns:
ax (matplotlib.ax)
pos (dict) – (X, Y) positions for each node:
{node_id: (x, y)}.
Examples
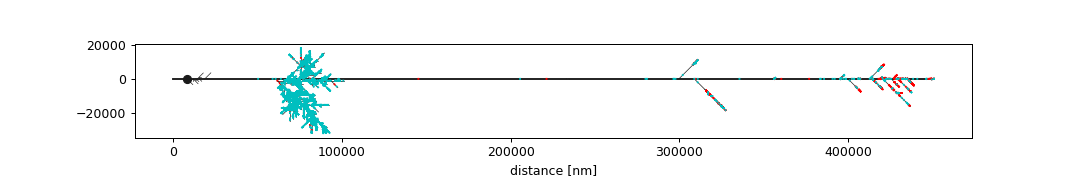
Plot neuron in “subway” layout:
>>> import navis
>>> n = navis.example_neurons(1).convert_units('nm')
>>> ax, pos = navis.plot_flat(n, layout='subway',
...                           figsize=(12, 2),
...                           connectors=True)
>>> _ = ax.set_xlabel('distance [nm]')
>>> plt.show()
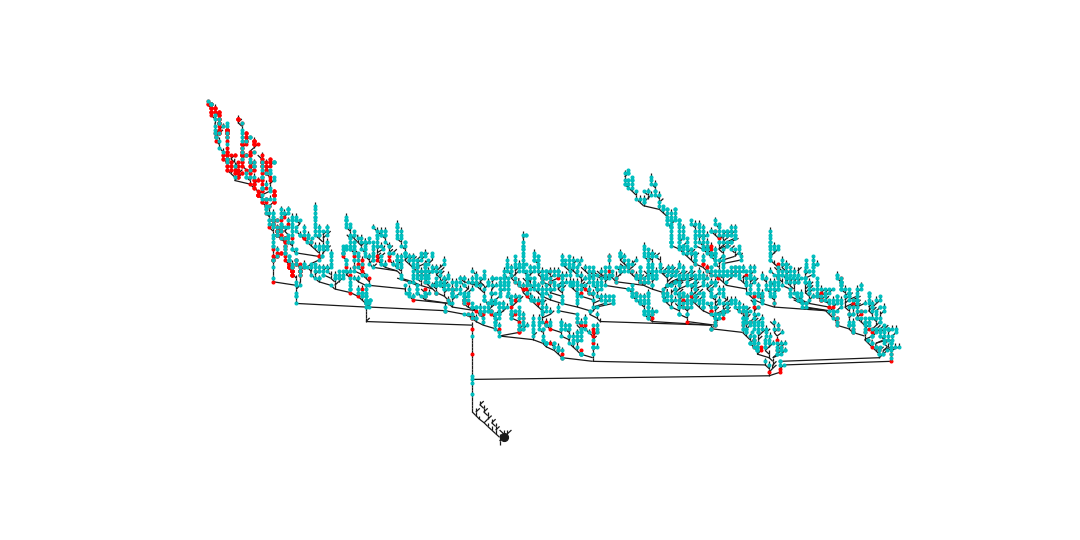
Plot neuron in “dot” layout (requires pygraphviz and graphviz):
>>> # First downsample to speed up processing
>>> ds = navis.downsample_neuron(n, 10, preserve_nodes='connectors')
>>> ax, pos = navis.plot_flat(ds, layout='dot', connectors=True)
>>> plt.show()
To close all figures (only for doctests)
>>> plt.close('all')
See the plotting tutorial for more examples.