neuPrint
Neuprint is a service for presenting and analyzing connectomics data. It is used to host the Janelia EM reconstructions from a Drosophila hemibrain at https://neuprint.janelia.org/.
neuprint-python is a Python library that lets you query data directly from a neuprint server. You can install it from PyPI:
pip3 install neuprint-python
navis.interfaces.neuprint wraps neuprint-python and adds a few functions to fetch and convert data into navis objects.
# Import navis
import navis
# Import neuprint wrapper by navis
import navis.interfaces.neuprint as neu
First set up the connection:
You can either pass your API token directly or store as NEUPRINT_APPLICATION_CREDENTIALS environment variable. We will use the latter option here:
client = neu.Client(
"https://neuprint.janelia.org/",
# token="MYLONGTOKEN" # use this to instead pass your token directly
dataset="hemibrain:v1.1",
)
You can use all of neuprint’s functions:
mbons, roi_info = neu.fetch_neurons(
neu.SegmentCriteria(instance=".*MBON.*", regex=True)
)
mbons.head(3)
| bodyId | instance | type | pre | post | downstream | upstream | size | status | cropped | statusLabel | cellBodyFiber | somaRadius | somaLocation | roiInfo | notes | inputRois | outputRois | |
|---|---|---|---|---|---|---|---|---|---|---|---|---|---|---|---|---|---|---|
| 0 | 300972942 | MBON14(a3)_R | MBON14 | 543 | 13634 | 4340 | 13634 | 1563154937 | Traced | False | Roughly traced | None | NaN | None | {'MB(R)': {'pre': 17, 'post': 13295, 'downstre... | None | [MB(+ACA)(R), MB(R), SIP(R), SLP(R), SMP(R), S... | [MB(+ACA)(R), MB(R), SIP(R), SLP(R), SMP(R), S... |
| 1 | 394225044 | MBON14(a3)_L | MBON14 | 187 | 5172 | 768 | 5172 | 355138411 | Traced | False | Roughly traced | None | NaN | None | {'MB(L)': {'pre': 185, 'post': 5143, 'downstre... | None | [MB(L), SIP(L), SNP(L), aL(L)] | [MB(L), SIP(L), SNP(L), aL(L)] |
| 2 | 422725634 | MBON06(B1>a)(AVM07)_L | MBON06 | 1356 | 21000 | 9584 | 21000 | 3118470391 | Traced | False | Roughly traced | None | NaN | None | {'MB(R)': {'pre': 777, 'post': 20390, 'downstr... | None | [CRE(-ROB,-RUB)(R), CRE(R), INP, MB(+ACA)(R), ... | [CRE(-ROB,-RUB)(R), CRE(R), INP, MB(+ACA)(R), ... |
- NAVis has added three functions to
neu: navis.interfaces.neuprint.fetch_roi(): returns anavis.Volumefrom a ROInavis.interfaces.neuprint.fetch_skeletons(): returns fully fledgednavis.TreeNeuron- nodes, synapses, soma and allnavis.interfaces.neuprint.fetch_mesh_neuron(): returnsnavis.MeshNeuron- including synapses
mb = neu.fetch_roi("MB(R)")
mb
<navis.Volume(name=MB(R), color=(0.85, 0.85, 0.85, 0.2), vertices.shape=(57913, 3), faces.shape=(115856, 3))>
mbon_skeletons = neu.fetch_skeletons(
neu.SegmentCriteria(instance=".*MBON.*_R", regex=True), with_synapses=True
)
mbon_skeletons.head()
| type | name | id | n_nodes | n_connectors | n_branches | n_leafs | cable_length | soma | units | |
|---|---|---|---|---|---|---|---|---|---|---|
| 0 | navis.TreeNeuron | MBON23(a2sp)_R | 423382015 | 14190 | 5200 | 1195 | 1225 | 449662.18750 | 2364.0 | 8 nanometer |
| 1 | navis.TreeNeuron | MBON19(a2p3p)_R | 423774471 | 6944 | 1783 | 549 | 561 | 246499.53125 | 1781.0 | 8 nanometer |
| 2 | navis.TreeNeuron | MBON15-like(a'1a'2)_R | 457175171 | 9051 | 2299 | 548 | 561 | 325558.90625 | 8810.0 | 8 nanometer |
| 3 | navis.TreeNeuron | MBON16-like(a'3a)_R | 457196643 | 9769 | 4016 | 900 | 913 | 408057.59375 | 5974.0 | 8 nanometer |
| 4 | navis.TreeNeuron | MBON14(a3)_R | 300972942 | 22834 | 14177 | 2297 | 2369 | 758249.75000 | NaN | 8 nanometer |
# Generate a 3D plot
fig = navis.plot3d([mbon_skeletons[0], mb])
mbon_skeletons[0]
| type | navis.TreeNeuron |
|---|---|
| name | MBON23(a2sp)_R |
| id | 423382015 |
| n_nodes | 14190 |
| n_connectors | 5200 |
| n_branches | 1195 |
| n_leafs | 1225 |
| cable_length | 449662.1875 |
| soma | 2364 |
| units | 8 nanometer |
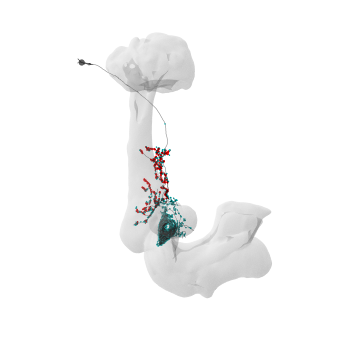
# Make a 2d plot
import matplotlib.pyplot as plt
fig, ax = navis.plot2d(
[mbon_skeletons[0], mb], c=(0, 0, 0, 0.5), method="3d", connectors=True, lw=0.5
)
# Rotate to top view
ax.elev = -90
plt.show()
All navis functions for analysis & visualization should work on these neurons. If not, please open an issue on Github.